The business seems to be doing better, but you have reporting to show how well it's actually doing? You want to collect data and turn it into information. This allows the business to make decisions based on actionable reporting. How much business intelligence (BI) does your organization have?
COTS Applications For Actionable Reporting
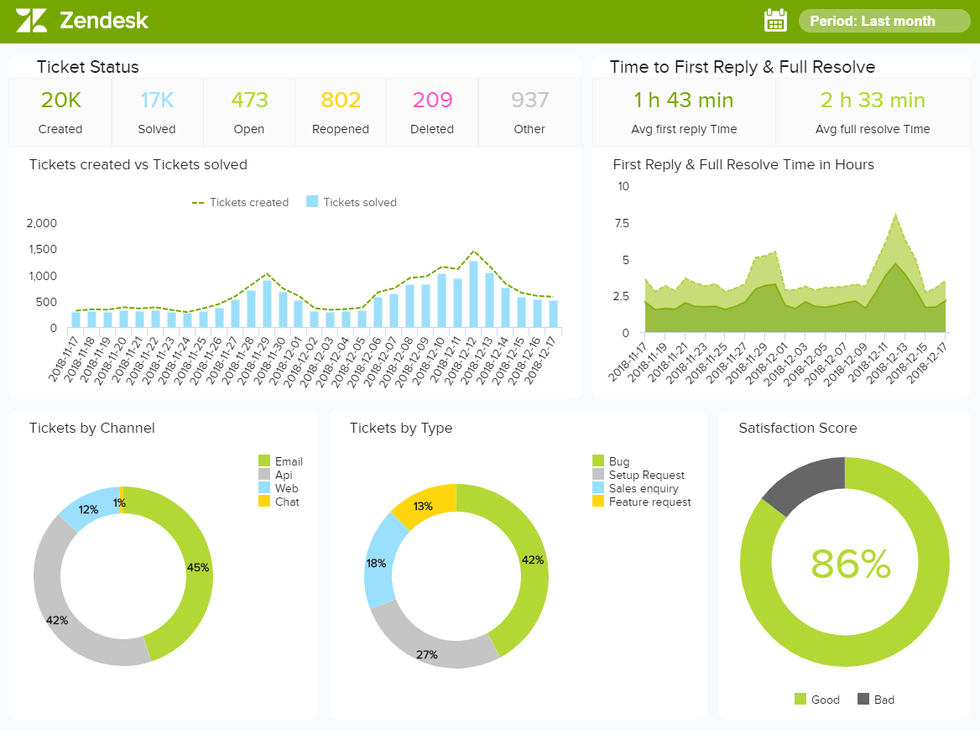
Source - Zendesk
Most COTS (commercial-off-the-shelf) applications will have standard/canned reports. These are the “common” reports used by customers. If you’re implementing a new system and there are many standard reports, start with 10 top reports so you don’t overwhelm the end users. If you’re not sure what these are, ask the vendor to recommend them (especially if you’re changing your process and following the vendor’s best practice). Then the end users can utilize other standard reports as they get more comfortable and familiar with the application.
For example, if you just purchased a new phone system for the call center, find the reports that detail measurements such as the number of calls, dropped calls, wait time, peak times, etc.
Identify and define key performance indicators (KPIs), which are measurable values to analyze for better decision making. KPIs may be related to a specific function, line of business, or group of individuals. You can take a group of KPIs and create a dashboard. For example, some KPIs related to the help desk are:
- Tickets by status (e.g., open, on hold, completed, canceled)
- Tickets assigned by technician
- Average resolution time
- Rate of first-time resolutions
- Customer satisfaction
Once you’re comfortably leveraging the standard reports, you may want to ask the vendor (or your team’s developer/programmer) to customize standard reports or create custom reports with additional specific information you’re looking for. This may involve combining data from multiple tables within the application.
Two typical ways to serve these reports: 1) “push” reports to the end users on a scheduled frequency such as via email daily; or 2) have the end user “pull” reports which gives them the ability to access the reports as needed.
But reporting isn’t limited to COTS applications. You can create remarkable reports using Excel such as PivotTables, Pivot Charts, or Slicers.
Other Tips & Tools For Actionable Reporting
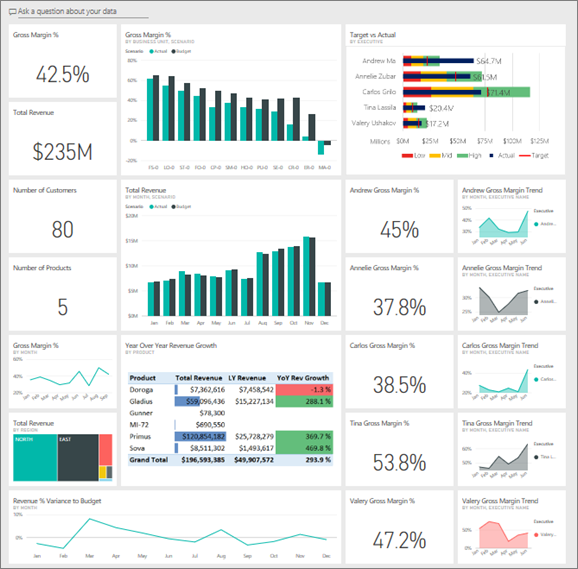
Another phenomenal visualization tool that is part of Office 365 is Power BI. It’s part of the Microsoft family (similar to Excel) so it’s straightforward to use. You can create a dashboard visualizing year-over-year comparisons, market segmentations, drill downs, etc.
If you’re new to Power BI, you can download the free desktop version (which admittedly does have limitations). If you find that Power BI does meet your basic reporting needs and you want more, then you can upgrade to the Pro license.
If you have enormous amounts of data, you may want to consider creating a data lake (raw data) or data warehouse (structured data). You can pull in data from multiple disparate systems into one central repository. There are ETL (extract transform load) tools to load the data into the data warehouse. You can cube the data so that the end users can roll up, drill down, and slice the data, do “what if” scenarios, etc.
TIP: If you allow end users to create their own reports, it’s critical that they understand the various data fields. Are you able to give them some type of data dictionary, or are they able to certify the results? It would be disastrous if they selected the wrong date or revenue field which produced incorrect results and sent the report to the board of directors.
Other reporting considerations:
1. Have a separate reporting database so that you don’t affect the production database. You don’t want an end user to kick off a complex query inadvertently causing production response to come to a crawl or even freeze.
- If you do set up a reporting database you need to decide how frequently the data will be updated—real time, once in the evening, etc.
2. Data needs to be secured appropriately (security). Who should have access to specific data fields should be determined by the data owner. For example, only a small handful of people should be able to access salary/payroll information.
3. Data should be classified such as public, internal, confidential, or restricted. Access should be controlled as appropriate.
4. Create a customer portal (extranet) to empower your customers (also partners and vendors) so that they can pull their own reports and information.
There is a quote by Lois Horowitz: “Not having the information you need when you need it leaves you wanting. Not knowing where to look for that information leaves you powerless. In a society where information is king, none of us can afford that.”
For more information on actionable reporting, follow me on LinkedIn!
- How To Conduct Market Segmentation To Drive Conversions - Work ... ›
- Chief Data Analytics Officer (CDAO): From Mindsets To Skills - Work ... ›
- How To Get Management Feeling Safe With Data In The Cloud ... ›
- How To Ensure The Data Mesh Doesn’t Create A Data Mess - Work It Daily ›
- How To Engage Customers In Real Time - Work It Daily ›
- Actionable Reporting (And AI) In A Data-Driven World ›

 Bigstock
 Bigstock
 Bigstock